As the commerce layer between content and conversion, Diddo captures first-party data at the moment of purchase - offering a unique lens into user behavior, product trends, and campaign performance. All insights are delivered in a secure, customizable dashboard.
This section covers:
- Admin dashboard
- Why this data matters
- Who uses this data
- Custom data views
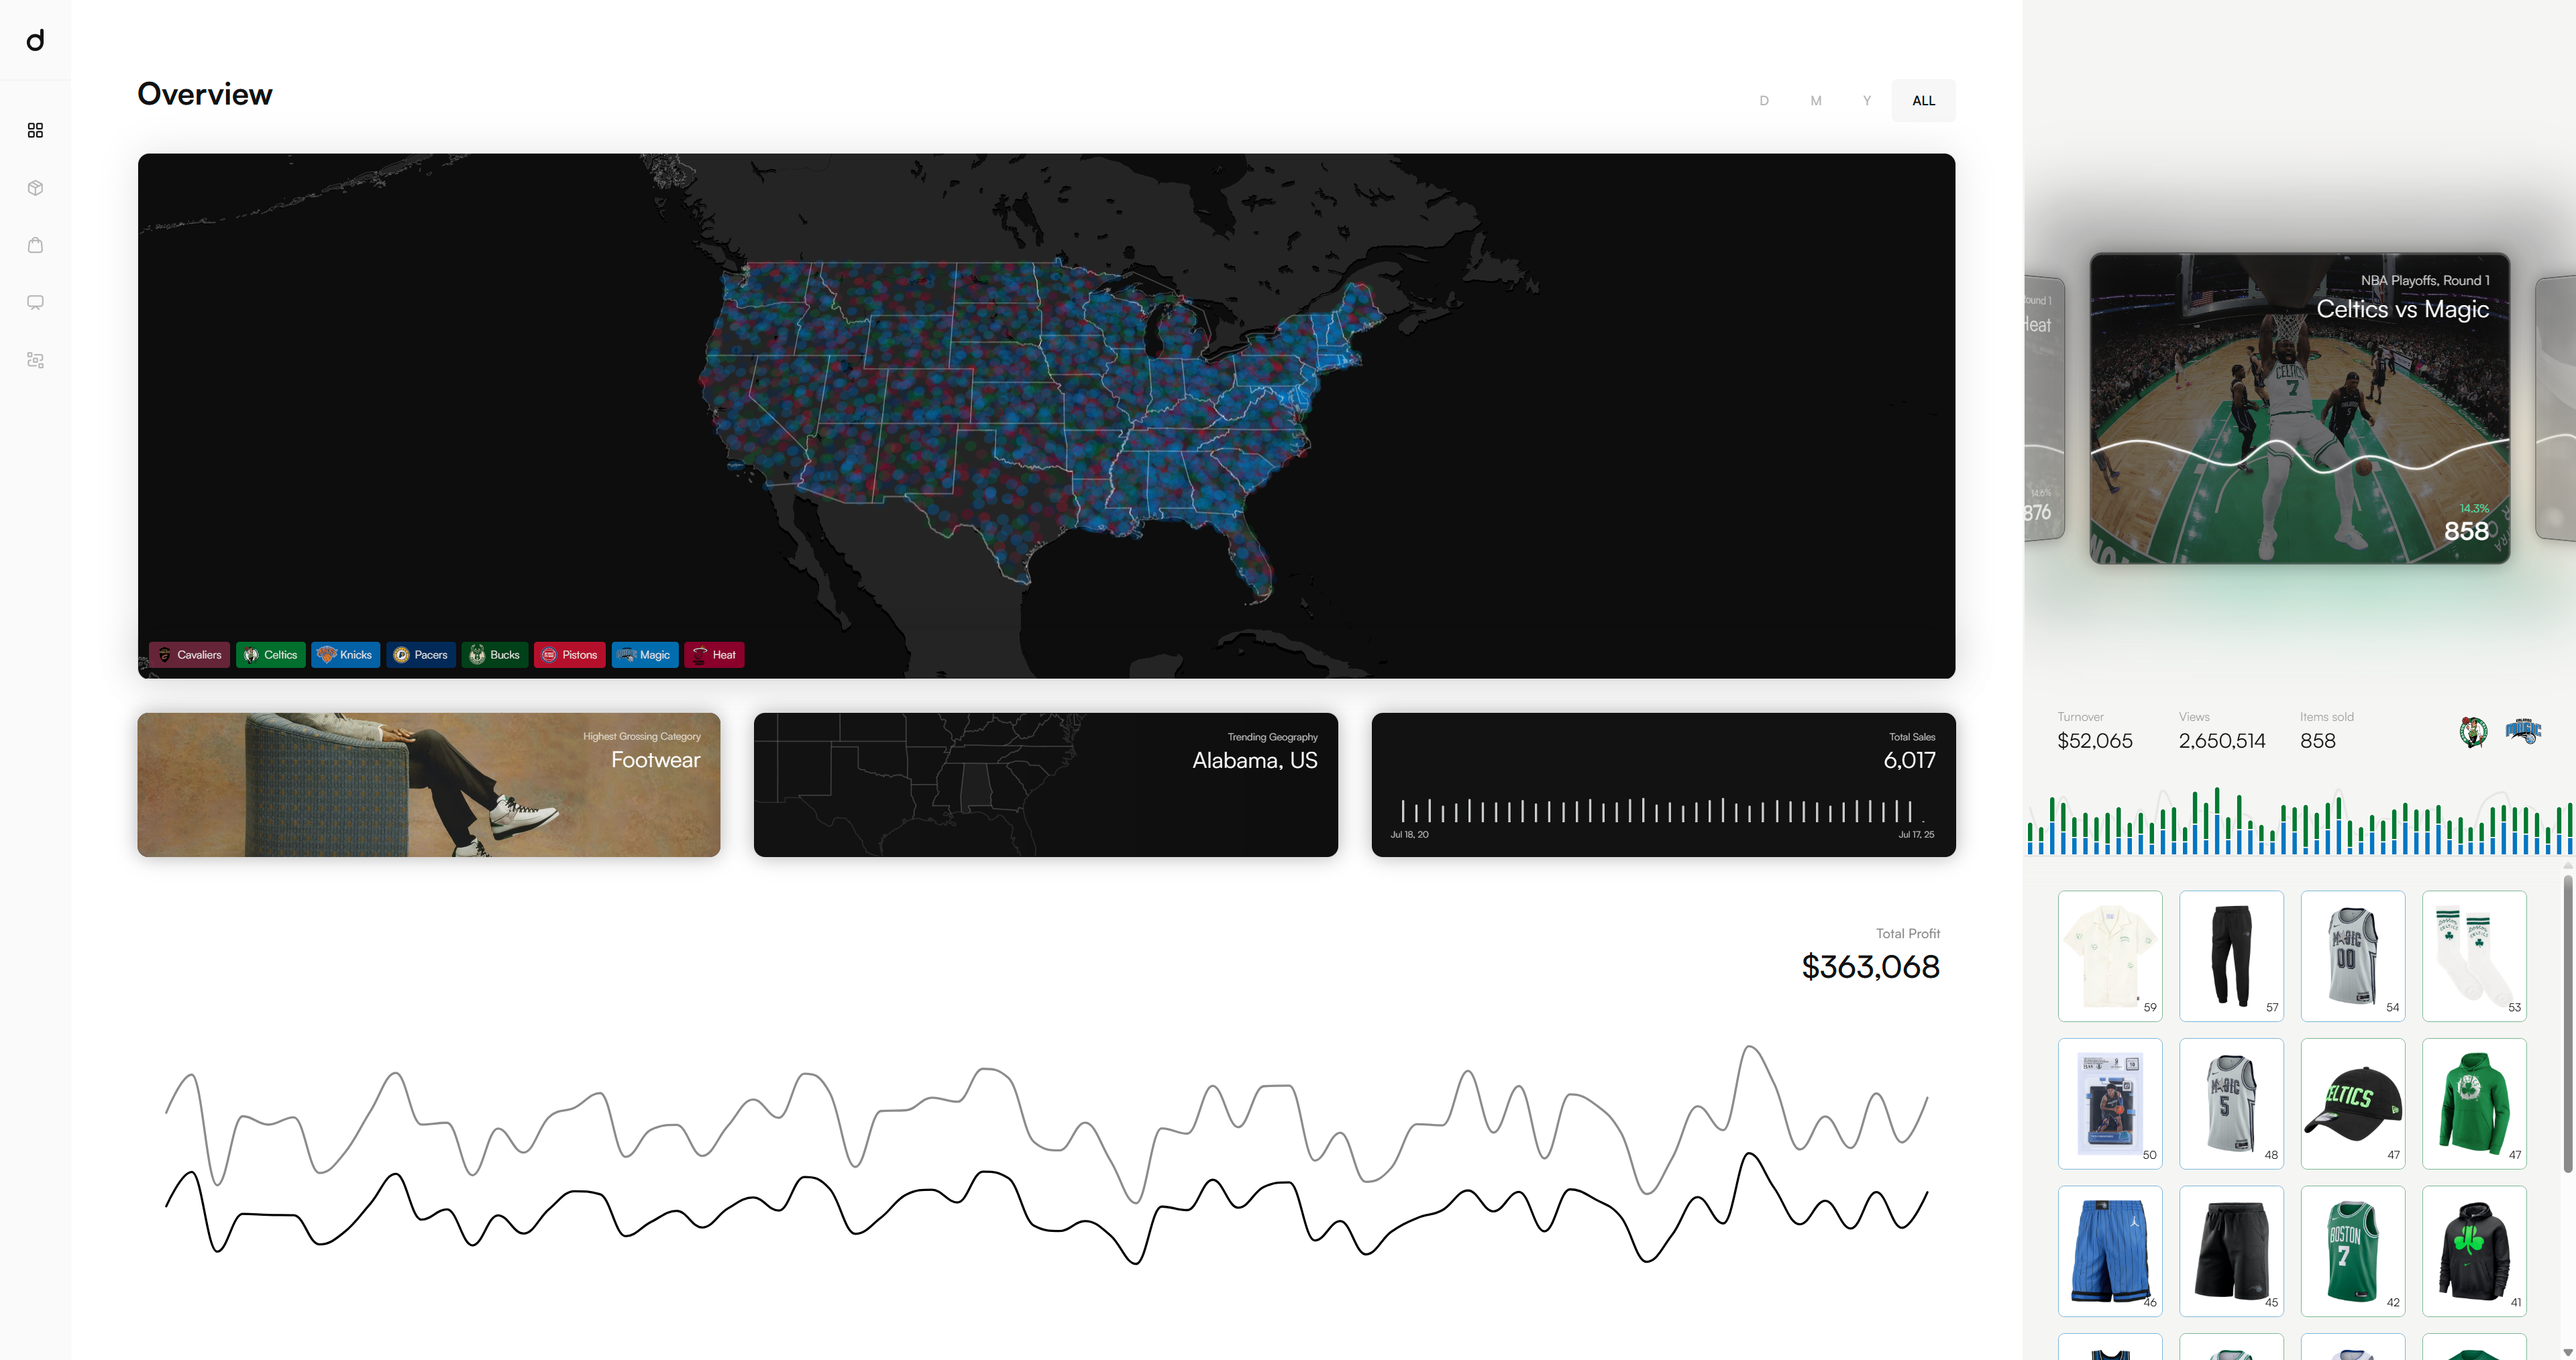
🖥️ Admin Dashboard
Your live dashboard provides real-time visibility into:
- Product sales by team, category, brand, or campaign
- Engagement by content type, platform, or region
- Conversion breakdowns by audience segment or interaction
🔗This demo shows NBA merchandise sold via Fanatics during regular season games. All visuals are customizable — including filters, chart types, and tracked metrics. Note that data depth depends on brand integrations: some merchants provide full visibility, while others may be more limited. We're happy to help expand access.
📈 Why This Data Matters
Most platforms capture either what users see or what they buy - but not both.
- Brands know what sells, but not what sparked the sale
- Content owners know what drives engagement, but not revenue
Diddo bridges this gap - connecting content moments to conversion events, so you know exactly what drives performance.
🎯 Who Uses This Data?
Our insights power a wide range of use cases:
- Media & Content Platforms: Streamers, publishers, apps
- Brands & Retailers: Growth, eComm, and marketing teams
- Talent & IP Holders: Creators, athletes, agents
- Analysts & Investors: Market intelligence and forecasting
🧩 Need a Custom View?
We can deliver insights via:
- A tailored dashboard
- Real-time Slack alerts
- Direct API integrations
Let us know what matters most to your team — and we’ll make it visible.